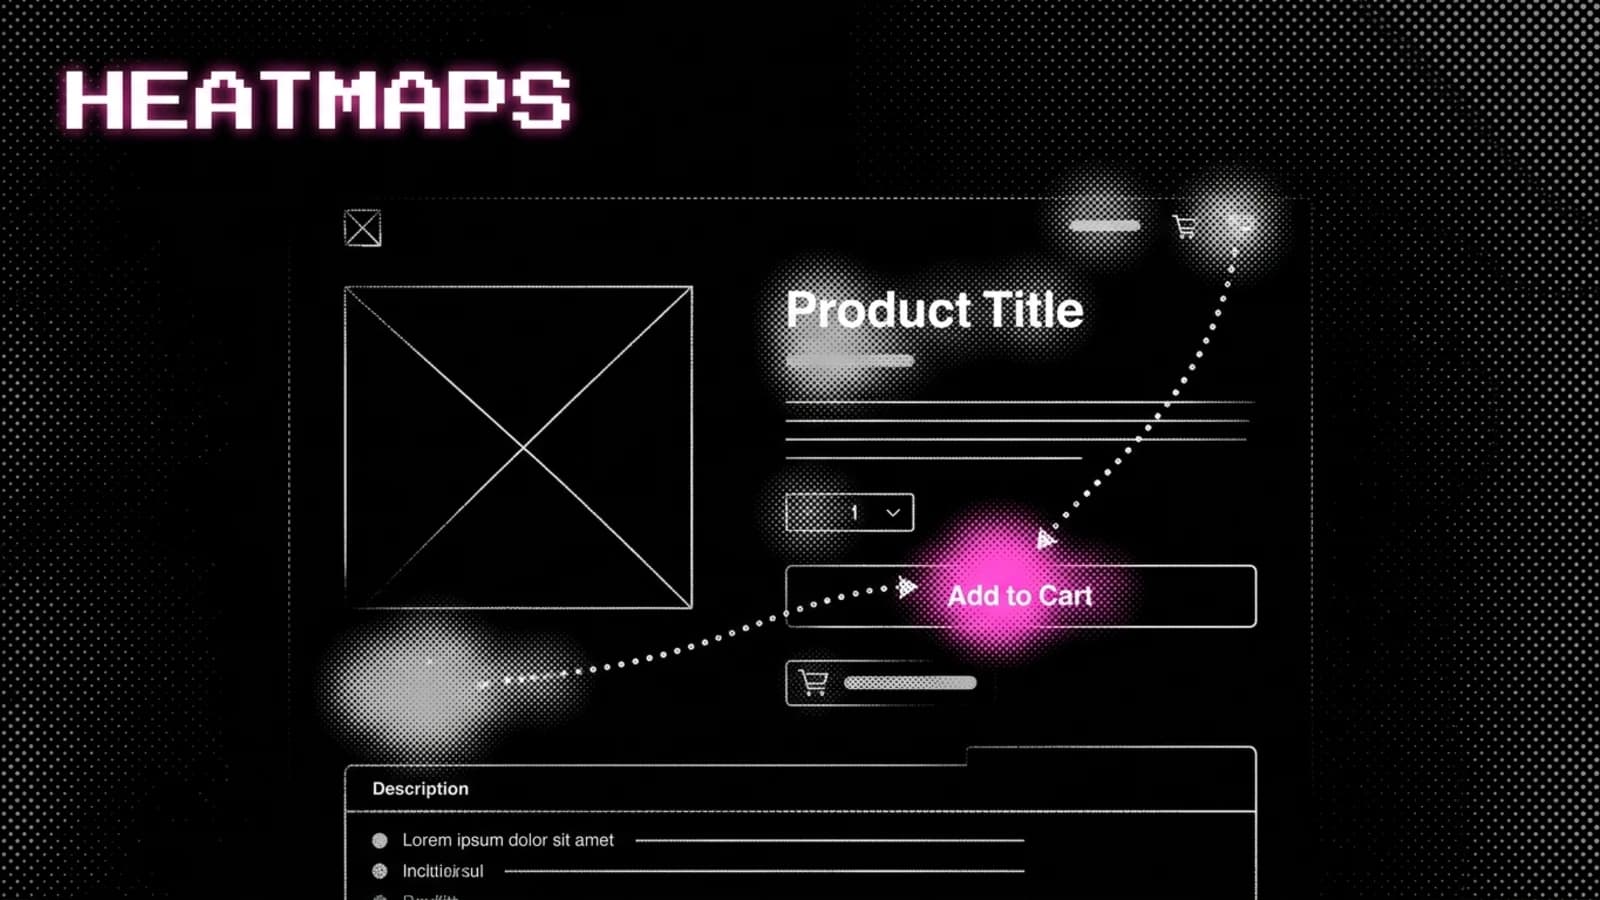
The clickmap showed something I didn't expect. On a subscription store where subscribe-and-save was the only preselected option, the collapsed one-time-purchase accordion was still drawing heavy clicks.
It was hidden. People went looking for it anyway, which told me there was latent demand for a one-time purchase that the page was actively suppressing.
That's what a heatmap is good for: behaviour you didn't design for. It's also where the trouble starts, because it shows what people did, not what it was worth. This guide covers how to run these tools properly on Shopify, and how to read them without talking yourself into the wrong change.
It's written for Shopify store operators doing roughly $500k to $5M+ a year, not for SaaS product teams. Every recommendation below is judged on what matters to a store: product pages, cart, checkout and the cost of being wrong.
Key Takeaways
- Heatmaps show where attention goes. Recordings show why a session stalled. You need both, plus your funnel numbers, to make a decision.
- Install through the vendor's Shopify app, not by pasting code into your theme, and make sure the script respects customer consent.
- Most stores cannot record the checkout. Shopify limits the events that make checkout recordings possible to Shopify Plus.
- Start every session with one page and one question. Watching random recordings is entertainment, not research.
- Heatmaps cannot tell you lifetime value, cannot fix bad tracking, and need traffic. I've lost arguments on all three.
What heatmaps show, and what session recordings show
A heatmap aggregates thousands of visits into one picture of where people click, tap and how far they scroll. A session recording replays one visit, cursor movement and all. One tells you where attention clusters. The other tells you what a single person was trying to do when they gave up.
Neither tells you how much revenue a page loses. That number lives in your Shopify analytics funnel. The three work as a set:
| Source | What it answers | What it can't answer |
|---|---|---|
| Funnel data (Shopify analytics, GA4) | Where people drop out, and how many | Why they dropped |
| Heatmaps (click, scroll, move) | Which elements get attention on one page | Whether that attention leads to a purchase |
| Session recordings | What one visitor tried, hesitated over or misread | Whether that visitor is typical |
The funnel picks the page. The heatmap picks the element. The recordings explain the behaviour. Skip the first step and you end up optimising a page that wasn't leaking much to begin with.
Installing a heatmap tool on Shopify
Use the vendor's app from the Shopify App Store wherever one exists. It's the cleanest install, it's easy to remove, and you never touch theme code.
Option 1: the vendor's Shopify app
Clarity, Lucky Orange and Contentsquare (Hotjar's successor) all install this way. Microsoft's own instructions for Clarity are to install the "Microsoft Clarity: AI Insights" listing and switch the tracking script on from the app settings (Microsoft Learn, 2025). Hotjar is now part of Contentsquare, and new Hotjar accounts can no longer be created (Contentsquare, 2026). New users install the official Contentsquare Analytics app (Shopify App Store, 2026). The 'Hotjar Install' listing is a paid third-party installer that says it is not affiliated with Hotjar and needs an existing Hotjar tracking code (Shopify App Store, 2026). Lucky Orange describes its connection as a one-click install with no tracking code to add (Lucky Orange, 2026).
Option 2: pasting the snippet into theme.liquid
The older method is pasting the tracking code before the closing </head> tag in theme.liquid. It still works, but snippets in theme code outlive app uninstalls and theme duplications, and they sit outside Shopify's consent handling. If Clarity is already installed this way, Microsoft says the app migrates you without code changes.
The method that no longer works
A lot of install guides still tell you to paste your Hotjar code into Settings > Checkout > Additional Scripts to track the order confirmation page. On non-Plus plans, Shopify made that box view-only on August 28, 2025, and Thank you and Order status page customisations now go through blocks and pixels (Shopify Help Center, 2026). If a guide tells you to use it, the guide is out of date.
Consent and personal data
Shopify's cookie banner governs Shopify's own pixels. For everything else, Shopify's help centre is explicit. Third-party cookies or pixels installed manually or through apps may need a third-party banner or custom logic to honour consent (Shopify Help Center, 2026).
The tool for that custom logic is the Customer Privacy API, which lets a script check permissions such as analyticsProcessingAllowed() before it starts recording (Shopify, 2026). Ask your vendor whether its app reads it. If they can't answer, assume it doesn't.
Then check masking. Recordings capture what's on screen, and a customer account page is full of names and addresses. Clarity masks input boxes in every mode, and its default "Balanced" mode also masks numbers and email addresses (Microsoft Learn, 2025). Whatever tool you use, open five recordings of your account and cart pages and look at what's visible before you share access with anyone.
Can a heatmap tool record the Shopify checkout?
On most Shopify plans, no. On Shopify Plus, some tools can. That's the short answer to every "hotjar shopify checkout" search, and it comes from Shopify's rules rather than from any one vendor.
Here's the mechanism. Shopify's pixels load on the storefront, checkout, Thank you and Order status pages. But the pixel sandbox cannot automatically detect "clicks and mouse movement to create heatmaps from DOM scraping" (Shopify Help Center, 2026). Heatmaps and recordings work by reading the page, so a sandboxed script on checkout has nothing to draw with.
Shopify's workaround is the Advanced DOM Events API. It exists to "recreate user journeys and interactions for session recording and/or heatmaps", and the scope is only granted to apps that offer those features. On checkout, though, "these events are limited on checkout to stores on the Shopify Plus plan" (Shopify, 2026).
What that means for each tool, from their own documentation:
- Microsoft Clarity: for Shopify Plus accounts, checkout and post-checkout pages are tracked through Shopify's pixel (Microsoft Learn, 2025).
- Lucky Orange: on standard plans it tracks checkout events, but you won't see recordings or heatmaps of the checkout page (Lucky Orange, 2026). It also claims to be the only tool that records Plus checkouts. That's a vendor claim, and Microsoft's documentation says Clarity covers Plus checkouts too.
- Hotjar / Contentsquare: Hotjar no longer takes new accounts. Contentsquare's own app listing says it analyses Shopify storefront and checkout pages (Shopify App Store, 2026), but it doesn't say whether checkout replay works off Plus, and Shopify limits checkout DOM events to Plus. Ask Contentsquare before relying on it.
If you're not on Plus, stop trying to watch checkout and read it instead. Shopify's analytics shows how many sessions reach checkout and how many complete it. That drop is the number to work on, and the Shopify checkout optimization guide covers what actually moves it.
Which tool to install
Pick on billing model and checkout coverage, then stop comparing. The differences between these tools matter far less than whether you open them weekly with a question.
| Tool | Billing model (checked 2026-10-16) | Shopify install | Checkout recordings | Full comparison |
|---|---|---|---|---|
| Microsoft Clarity | Free; Microsoft says "no limits on traffic" (Clarity, 2026) | App Store app | Plus only, via Shopify's pixel | Microsoft Clarity vs Hotjar |
| Hotjar (now Contentsquare) | No new Hotjar sign-ups; Contentsquare's free plan is metered on monthly sessions and records a share of them as replays (Contentsquare, 2026) | Contentsquare app (official); Hotjar Install is third-party | Not confirmed | Hotjar alternatives |
| Lucky Orange | Free plan on the Shopify App Store; paid plans billed by monthly sessions (Shopify App Store, 2026) | App Store app | Plus only (vendor documentation) | Lucky Orange for Shopify |
Hotjar's pricing page now redirects to Contentsquare's, so read the plan details there. Prices are left out on purpose, because they change faster than comparison tables do. If you're undecided, install the free tier that answers your current question and move later.
A repeatable way to read heatmaps and recordings
Five steps, and the first does most of the work: one page, one question. Without a question, you'll watch recordings until something looks odd, then fix it whether or not it costs you money.
1. Let the funnel pick the page. Open your Shopify analytics and find the biggest drop between sessions, add to cart, checkout and purchase. If product pages lose most people, that's your page. Split by device before you go further, because a mobile leak hides inside a blended average. The mobile conversion rate piece covers why the two behave so differently.
2. Write the question down. "Why do mobile visitors on the bestseller page not add to cart?" is a question. "Let's see what people do" is not.
3. Read the heatmap for that page only. Check whether the elements you designed for action get the action. Then look for heavy clicks on things that aren't links, and attention on sections you assumed nobody read. The unexpected clicks are usually the finding.
4. Filter recordings by behaviour, not by date. Don't watch the last 50 sessions. Watch the ones that match the question, such as visitors who left the page without adding to cart. Use rage-click or dead-click filters where your tool offers them.
5. Turn it into a hypothesis, then decide how to prove it. A heatmap pattern is evidence for a change, not proof that the change will work. If the page has the traffic, test it. My working rule of thumb for a trustworthy A/B result is a few hundred conversions per variation, on several thousand sessions. Below that, even big observed lifts risk being false positives.
This is the same loop I run in an audit, and the conversion rate optimization process post covers how it repeats month to month.
Want this done on your store? The conversion rate optimization audit reads your funnel, heatmaps and recordings against 78 documented patterns. You get back a ranked list of what to fix first.
Decisions I've made from a clickmap
Four real cases, anonymised to the niche.
The slider the designer didn't want. On a skincare product page, a before/after slider was the single most-clicked element. The clickmap showed people clicking through every slide, not just the first. That justified building the arrows carousel the designer didn't want, because the behaviour said people wanted more of exactly that content.
The arrow on the button. CTA arrows draw their own click volume. As I put it to one client: "A lot of people click the arrow when it's there and others click the text, so it's a useful element to have." A heatmap is the only way you'd see that a decorative arrow is doing work.
The page that got reordered. A behavioural report reordered a whole page. "The report says users interact with this, so we moved it up. We also lead with proof more, since the text testimonials weren't really read. They need photos to get attention." Text-only reviews looked fine in the design file and were invisible in the data.
The feature that didn't get built. A personalization preview was used by only a small minority of visitors. That usage data was my argument against an expensive gallery integration, because the extra development couldn't be justified for so few people.
Notice that the last one saved money rather than making it. Heatmaps are at least as useful for killing work as for starting it.
What heatmaps cannot tell you
A heatmap is a picture of behaviour. It is not a picture of value, it needs volume to mean anything, and it is only as honest as the tracking underneath it. I've learned each of those the hard way.
They show clicks, not lifetime value
Clickmap evidence like that hidden accordion is what I took into an argument with a subscription-first client. I argued hard for showing the one-time option. I lost. The client stayed fully subscription-first, based on their own prior retention work.
They had data I didn't. A heatmap can show you that people look for a one-time option. It cannot show you what a subscriber is worth over a year compared with a one-time buyer. I still think hiding the one-time option is usually wrong. My own caveat on that belief is that a strong retention strategy can justify a pure subscription model. Decide with data, not dogma, and know which data each tool can and can't give you.
They need traffic
On a B2B events site, I wanted to settle an above-the-fold call-to-action debate with heatmap data. The client preferred keeping the main button top-right. They asked for concrete arguments first and deferred click-testing to a higher-traffic campaign.
That was a reasonable call. A heatmap built from a few hundred sessions is a sketch, not a measurement. On thin traffic, use heatmaps to generate questions, not to settle them.
They can't rescue bad tracking
The clearest lesson came from a sea-moss brand that had gone viral on TikTok. Sales were already in a downtrend and tracking was poor. The redesign shipped and revenue kept sliding. Only later did the data show add-to-cart clicks had risen sharply, with too little clean traffic to measure the effect properly.
The lift was real, and I couldn't prove it. A store in decline can absorb a genuine improvement and still look like a failure. Context and tracking come before judgment. Before you trust any heatmap, confirm your funnel events fire correctly and know what the trend was doing before you changed anything.
When to install one
Heatmaps are not a starting point. In the growth equation I use with Baseline clients, growth is conversions times implementation speed times ongoing optimization. Heatmaps, recordings, surveys and A/B testing all belong to the third part: the "we launched, now what?" stage.
If your product page is structurally broken, a heatmap will mostly confirm that people are confused. Fix the structure first. The conversion rate optimization audit breakdown covers that structural pass and where behavioural data fits into it. Once the page is sound, heatmaps become how you keep improving it.
FAQ
Can Hotjar or Microsoft Clarity record the Shopify checkout?
On most plans, no. Shopify's pixel sandbox cannot build heatmaps from the page, and the events that make checkout recordings possible are limited to Shopify Plus stores. Microsoft says Clarity tracks Plus checkouts through Shopify's pixel. On other plans, use your checkout funnel report instead of recordings.
How do I install Hotjar or Clarity on Shopify?
Install the vendor's app from the Shopify App Store, which loads the tracking code without editing your theme. Pasting the snippet into theme.liquid works but sits outside Shopify's consent banner. Hotjar is the exception: new accounts now go through Contentsquare's own app, and the 'Hotjar Install' listing only serves existing Hotjar accounts.
Do heatmap tools need cookie consent on Shopify?
Where your customers' privacy law requires consent, yes. Shopify's own help centre says scripts installed manually or through apps may need a third-party banner or custom logic to honour consent. The Customer Privacy API lets a script check whether analytics processing is allowed before it starts recording anyone.
Which heatmap tool is best for a Shopify store?
Start with whichever free tier lets you answer your current question. Microsoft Clarity is free with no stated traffic limit. Hotjar no longer takes new accounts; its successor, Contentsquare, has a free plan that records a share of sessions as replays. Lucky Orange's Shopify app has a small free plan. The tool matters far less than the question.
How much traffic do I need before heatmaps are useful?
There is no credible published floor for heatmaps, so treat what you see on a low-traffic page as a hypothesis. For an A/B test that confirms it, my working rule of thumb is a few hundred conversions per variation, on several thousand sessions. Below that, even big lifts can be false positives.
What should I look at first in a Shopify heatmap?
Start with the product page that gets the most paid traffic, on mobile. Check whether the add-to-cart button, the variant picker and the image gallery get the clicks you expect, then look for heavy clicks on elements that aren't links. Unexpected attention is usually the most useful finding on the map.
Get a second pair of eyes on the data
No tool tells you which change to make. The heatmap shows behaviour, the funnel shows cost, and someone still has to decide what it means.
That's the job of the conversion rate optimization audit: your funnel, heatmaps and recordings read together, ranked by impact. If you'd rather talk it through first, book a call and bring the page you're most worried about.